Monitoring a Yesod App with EKG
It’s been a long time since I’ve worked on the design of this blog. It’s honestly much prettier as a gist, if you’d rather read it there.
Monitoring is critical to a well-functioning production system. OS-level metrics like CPU load and RAM usage are a good start, but you’ll eventually want to record application-level metrics like how long it’s taking you to service each HTTP request, or how much time is spent in garbage collection. Once tracked, this data can be used by humans and machines (like monitoring systems) to gain insight into how your app is running.
In this post I’ll show how you can use EKG, a popular Haskell metrics library, to add application-level metrics to your Yesod app.
A Brief Overview of EKG Metric Types
EKG allows reporting four different types of metrics from your app:
Counters
A Counter is an integer metric that you can only increment or add to, and probably the most common one you’ll use. Example use cases:
- A counter that increments each time a request 500s lets you track exceptions. Too many 500s per minute might trigger an alert.
- A counter that increments each time you insert a row into a database would help you track why your database is under load.
Gauges
Gauges record a value that can go up and down. Unlike a counter, which records a one-off event like a request being made, a gauge implies the reported value will persist. Examples:
- A gauge might track the amount of jobs in a queue. If the gauge height is rising, you know you’re not processing the queue quick enough.
- A gauge might track the number of concurrent connections. You could monitor this value to make sure it doesn’t get too close to your maximum connection limit.
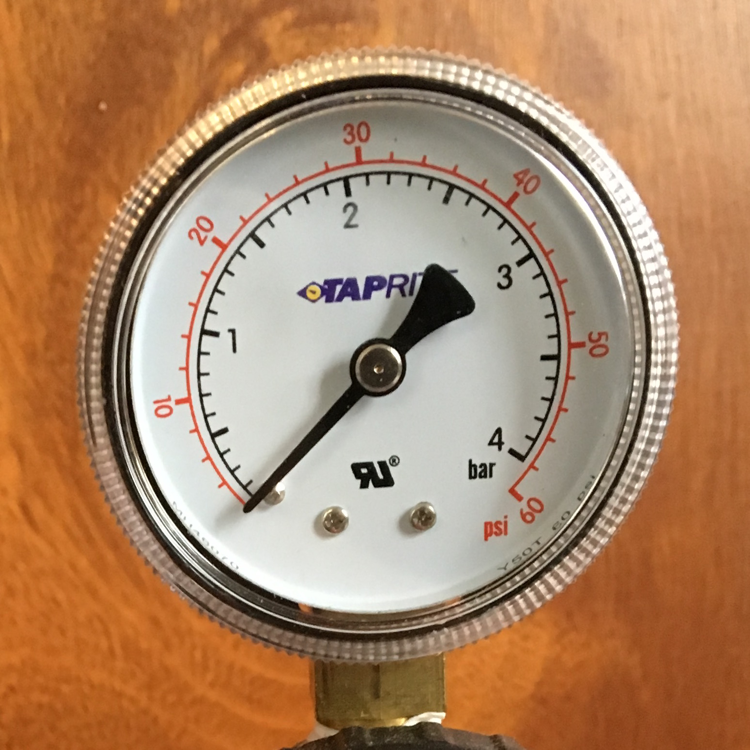
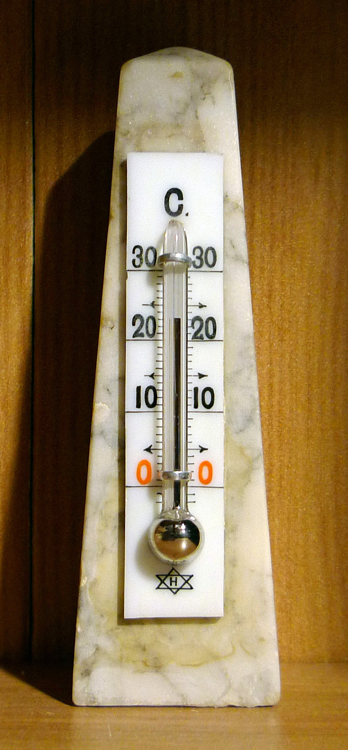
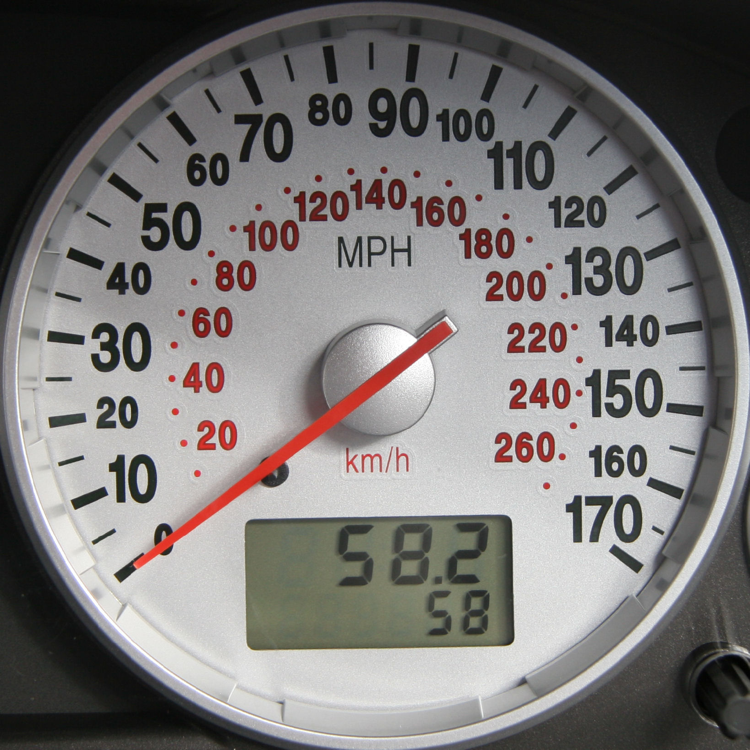
Real life gauges. Left to right: pressure gauge, thermometer/SCM tool, speedometer
Labels
Labels are an arbitrary string value your app can report. I don’t have much experience with labels. Example use case:
- A label might report the git SHA hash of the running application. This allows you to track if an old version of your code is running by mistake.
Distributions
A Distribution tracks a series of values, then computes statistical information about them. Examples should help illustrate:
- A web server might record the amount of time serving each request. The mean could be tracked to see if page serving is too slow.
- An ad network charging different amounts per ad impression might record each one. The count of events would tell them how many impressions they’re processing (like a counter), and the mean would tell them their average charge price.
- A
Distributionmight track the size of cookies in bytes. A highmaxvalue could warn you that your cookies are approaching the 4K size limit.
StatsD, Etsy’s Node.js daemon for tracking metrics, calls this a Timer (even though it has many more use cases). Unfortunately, EKG doesn’t track percentiles like StatsD does, which would allow you to see e.g. the 99th percentile response time, filtering out the 1% of outliers. (If you’re interested in contributing, there’s an issue open to implement this).
Viewing these Metrics
Now that you have a brief overview of the types of metrics EKG can track, we’ll see how it reports them to you via its built-in HTTP server.
Adding EKG
Start by adding ekg and ekg-core to the build-depends section of your .cabal file. Then just add forkServer "localhost" 8000 before you start your actual Yesod server in getApplicationDev:
-- Application.hs
import qualified System.Remote.Monitoring as EKG

getApplicationDev :: IO (Settings, Application)
getApplicationDev = do
    settings <- getAppSettings
    foundation <- makeFoundation settings

    EKG.forkServer "localhost" 8000

    ...
Note: The
mainfunction used for development isdevelMain, which calls intogetApplicationDev. In production you’ll useappMain, but we’ll stick to the development version for this guide.
forkServer will start up a metrics server with the default metrics (just Garbage Collection statistics). Open http://localhost:8000 to check it out:

If your Garbage Collection statistics are all 0, you’ll need to tell the Haskell runtime system (RTS) to collect GC statistics (As far as I can tell this came by default with
yesod devel).
EKG will also give you JSON output if you change your Accept Header, allowing machines to parse the data:
curl -H "Accept: application/json" http://localhost:8000/
Adding More Metrics
GC metrics are great, but we’d like to register metrics specific to our app. EKG keeps metrics in a Store and we’ll need one to do things like create counters. We’ll want to access it across our application, so we’ll follow the general Yesod pattern of adding it to our App datatype. We’ll also create a record, Metrics to hold the specific counters/gauges/etc. we make:
-- Foundation.hs
import qualified System.Metrics as EKG
import System.Metrics.Counter (Counter)

data Metrics = Metrics
    { homeRequestCounter :: Counter
    }

data App = App
    { appSettings     :: AppSettings
    ... -- other Fields
    , appMetricsStore :: EKG.Store
    , appMetrics      :: Metrics
    }
Then in makeFoundation, where we create our App, we’ll create those instances, using RecordWildCards to make it easy to fill out the fields:
-- Foundation.hs
import qualified System.Remote.Monitoring as EKG
import qualified System.Metrics as EKG

makeFoundation :: AppSettings -> IO App
makeFoundation appSettings = do
  -- Create the store
    appMetricsStore <- EKG.newStore
    -- When you create your own store you need to register GC metrics manually:
    EKG.registerGcMetrics appMetricsStore
    -- Create the individual counters/gauges/etc. we want to track here:
    homeRequestCounter <- EKG.createCounter "home.requests" appMetricsStore
    let appMetrics = Metrics {..}

    ... -- Other App initialization here

    let mkFoundation appConnPool = App {..}
Now that we’re using a custom store, we need to tweak how we launch the EKG server to use that store:
-- Foundation.hs
import qualified System.Remote.Monitoring as EKG

getApplicationDev :: IO (Settings, Application)
getApplicationDev = do
    settings <- getAppSettings
    foundation <- makeFoundation settings

    _ <- EKG.forkServerWith (appMetricsStore foundation) "localhost" 8000
Now that we can access our individual metrics from our App, we can use them in our Handlers. Here’s how we’d retrieve a Counter and increment it:
-- Home.hs
import qualified System.Metrics.Counter as Counter

getHomeR :: Handler Html
getHomeR = do
    app <- getYesod
    liftIO $ Counter.inc $ homeRequestCounter $ appMetrics app
After recompiling, hit your homepage with a bunch of refreshes, then head back to http://localhost:8000 to find your new metric in the sidebar. Click the little chart icon to graph the metric.


Sending Metrics to Graphite
EKG’s web frontend is convenient for trying out the library, but it’s not ideal for a production system:
- EKG doesn’t store historical metrics data. For a production system you’d want to store your metrics to disk so you can view data across restarts of your app, going back several weeks at least.
- EKG doesn’t aggregate counters across multiple servers, which you may want to horizontally scale.
- The web frontend is pretty basic. It’d be nice to have customizable graphs and dashboards.
- EKG is Haskell-specific. You’ll want to also store operating system metrics, like CPU load and RAM usage, with the rest of your data.
So instead of storing our metrics locally, we’ll send them to a database. Graphite is something of an industry standard for storing metrics data and interfaces with many other systems, so we’ll use that. Go install Graphite now if you’re following this as a guide.
ekg-carbon
We’ll send metrics to Graphite using the ekg-carbon package.
ekg-carbonisn’t in Stackage at the time of this writing, so you’ll need to add'ekg-carbon-1.0.5'to yourextra-depsif you’re using Stack.
Once you have ekg-carbon installed, replace forkServerWith with forkCarbonRestart. The defaultCarbonOptions will work for a standard carbon install on localhost. The lambda is an exception handler function for errors sending metrics to Carbon. The lambda simply prints the error and restarts (I think the data is lost in this case, but that’s usually fine for metrics, and even a design goal of systems like StatsD).
-- Application.hs
import System.Remote.Monitoring.Carbon

getApplicationDev :: IO (Settings, Application)
getApplicationDev = do
    settings <- getAppSettings
    foundation <- makeFoundation settings

    let store = appMetricsStore foundation
    _threadId <- forkCarbonRestart defaultCarbonOptions
                                   store
                                   (\ex restart -> do hPutStrLn stderr ("ekg-carbon: " ++ show ex)
                                                      restart)
Once again, restart your Yesod app and hit your homepage with some requests. You should be able to see the request data tracked in Graphite on the sidebar:

Click on the metric to graph it (Note: over such a small timescale, your metric may not graph very well)

If you’re happier with your data in Graphite, you can also remove the ekg package entirely and just depend on ekg-core, avoiding the large snap-server dependency of ekg. You’ll just need to replace imports of System.Remote.Monitoring with System.Metrics.
Side Note: Pulling data from Graphite
Prettier Graphs
Graphite’s interface is very, uh, Windows 95-ish. I actually really like it for exploring metrics, but if you want to create nice dashboards I recommend something like Grafana, which can query Graphite and generate pretty, configurable graphs.
Monitoring
You can also monitor your app by making queries to Graphite. I don’t have much experience in monitoring solutions, but at work we use Sensu to do monitoring.
Conclusion
Adding EKG to Yesod is very simple and probably worth doing for most Yesod apps. It costs you very little to add forkServer "localhost" 8000 to start tracking GC stats, and tracking application-specific metrics isn’t much more difficult. If you aren’t already, give EKG a shot and add it to your Yesod app.
Special thanks
- Thanks to Micah Fivecoate for reviewing this post multiple times. He found a bug despite no prior Haskell experience :)
- Thanks to Johan Tibbe, author of EKG, for reviewing this post and making several recommendations.